The Drake Equation vs. the Probability of Being Struck by a Boat Propeller
We recently completed our Developing a Consumer Guide for the Selection of Propeller Guards and Other Propeller Safety Devices post. Part of that project involved creating our Propeller Accident Risk Worksheet. In that worksheet we identify five categories of Propeller Accident Risk:
- Boat Specifications Risk– some boat types are more likely to be involved in a propeller accident than others.
- Operator Experience and Environment Risk – inexperienced operators in lakes crowded with inebriated boaters are more likely to be involved in a propeller accident.
- Water Conditions Risk – choppy water with floating and sunken debris is a recipe for disaster.
- Activities On and Near My Boat Risk – the more people in the water the more opportunity to hit one with your propeller.
- Exposure Time and Boater Fatigue Risk – The more time you spend on the water each year, the longer you are exposed to the risks. In addition, people out all day on a small boat in the summer heat suffer boater fatigue, dulling their response times. Boater fatigue also amplifies the effects of alcohol making their boat even more dangerous.
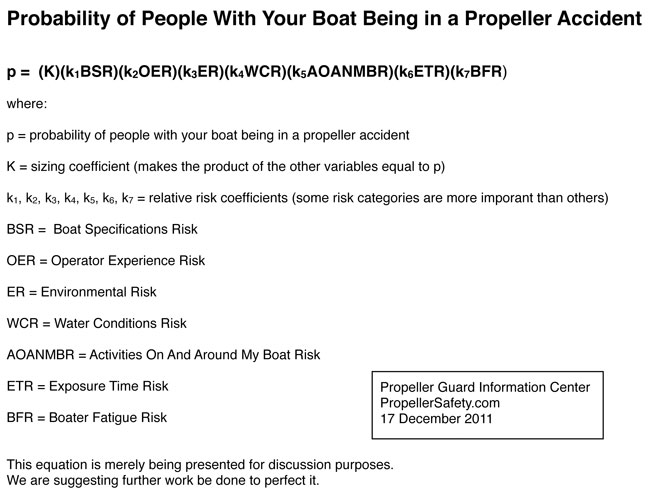
We started thinking about how we could calculate an the actual risk of a given boat (or the people with that boat) being involved in propeller accident and quickly realized that if all the risks were really contained within the five categories we identified (or if we were in a perfect world and were able to identify all the categories of risk and the risk of each category), the risk of a given boat being involved in a propeller accident during a year could be calculated something similar to:
p = Boat Specification Risk X Operator Experience Risk X Environment Risk X Water Conditions Risk X Activities On and Near My Boat Risk X Exposure Time Risk X Boater Fatigue Risk
Where p = the probability of the boat or people with the boat being involved in propeller accident within a certain time period.
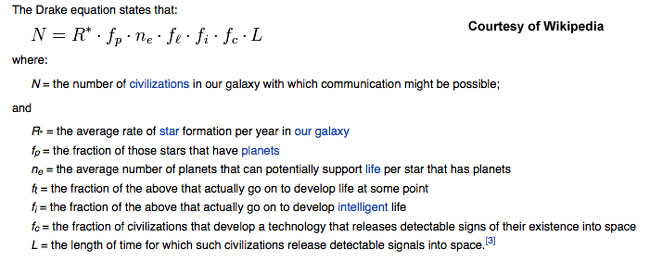
The moment I first thought of multiplying those probabilities, my mind flashed to the Drake Equation. As Frank Drake prepared for a 1961 meeting on detecting extraterrestrial intelligence, he penned a similar equation to estimate the number of worlds in our galaxy that might harbor intelligent life at this time.
Carl Sagan is known for quoting the equation, so some refer to it as the “Sagan Equation”. Carl Sagan did a tremendous job explaining the Drake Equation mathematically and then later in generalities in his Cosmos series.
Carl Sagan is so smooth at explaining the Drake Equation he reminds us of Robert Taylor, one of the boating industry’s expert witness in boat propeller injury cases.
We find it interesting the boating industry continues to claim propeller accidents are extremely rare. The press continues to annoy us by calling them “freak accidents”, but no matter what they call them, they continue to happen just like clockwork. Boat propeller accidents are happening due to the vast number of propeller driven boats and people on or in the water. Just like Sagan illustrates the vast number of stars gives rise to the potential for intelligent life on millions of planets, the vast number of propellers in the water on Planet Earth give rise to the potential for tens of thousands of propeller accidents.
Estimating the Propeller Accident Risk by Category
Just like Carl Sagan did, we can make some calculations from the equation we propose. In this case we know the average value of “N” which is the average probability of a given boat being involved in USCG BARD reported recreational boat propeller accident in a year. Yes, we know BARD under reports accidents, but this is a place to start the estimate that will not draw too much fire.
For example, in 2010, USCG’s Annual Boating Statistics report indicates there were 179 reported accidents in which a person was struck by a propeller. Boating Industry’s 2010 Market Databook (based on 2009 NMMA’s 2009 Statistical Abstract) estimates there are 8.24 million outboard powered boats, 1.10 million inboard powered boats, and 1.54 million stern drive powered boats in the United States. Those figures include both registered and unregistered boats for a total of 10.88 million recreational boats powered by outboards, inboards, or stern drives.
It is unlikely that a single boat would be involved in more that one BARD reportable propeller accident in a given year (although more than one person might be injured by a propeller in that single accident), so the probability of a single recreational powerboat being involved in USCG BARD reported recreational power boat accident in a given year is of the nature of (179 accidents)/(10.88 million boats) or .0000164 or .0000164 X 100 = .00164 percent.
Before someone starts bashing me about how small that number is, you need to recognize that propeller accidents tend to be clustered around certain boat types, certain boating activities, and certain behaviors. In those situations, the probabilities are much higher. Right now we are just trying to establish some base line numbers.
The variables on the right hand side – we see these probabilities each having value between zero and one. Thus, when they are multiplied, the output is a probability between zero and one.
Boat Specification Risk – this probability varies between zero and one, with a zero being boat that absolutely prevents all propeller injuries no matter what happens. A one would indicate a boat that has a propeller injury every time it is taken out. In reality, values would be somewhere in the middle with boat types more likely to be involved in propeller accidents having a higher boat specification risk.
Operator Experience Risk – ranges from zero to one with a superman boat operator with years of experience in boats like this one and in this particular vessel that could prevent all propeller accidents having a zero and an inexperienced operator that has never even been on a vessel like this one before, that boats wildly and runs over somebody every time they go out scoring a one.
Environment Risk – zero to one with a perfect environment with no other boats on the water and no one from your boat in the water as a zero. Crowded lakes with lots of wild boats and people in the water, including some from your boat would be closer to one. Such as party coves and rafting of many boats together during spring break.
Water Conditions Risk – zero to one with perfect calm, glass like water being near zero while nasty high winds, hard rain, rough water, floating and sunken debris would be near one.
Activities On and Near My Boat Risk – zero to one with higher scores for activities that put the most people in the water (swimming, water slides, towing inflatables, banana boats, skiing, wake boarding, swimming/floating behind a beached houseboat, wake surfing, teak boarding (note teak boarding is dangerous/illegal), swimming area near beach, excessive horseplay on the boat, bow riding, riding on gunnels, jumping from upper decks of houseboats, rafting of many boats together, etc.).
Exposure Time Risk – zero to one with a zero if no boats go on the water all year long, to a one if all recreational power boats are on the water every hour of every day all year long. Note exposure time would generally be much larger for a rental boat as they spend more time on the water than private boats.
Boater Fatigue Risk – zero to one with a zero for for boaters that are crisp and fresh, and a one for boaters that are totally out of it from boater to fatigue.
The seven variables above do not equally contribute to propeller accidents. A study of BARD data to estimate the frequency of each variable’s involvement in triggering the accident could be used to create a weighting coefficient for each risk. USCG’s Boating Risk Analysis INformation System (BRAINS) system may be of help in making this evaluation.
In addition, the product of the risks above would need to be multiplied by a coefficient to bring it in line with the actual average risk of any boat being involved in a propeller accident.
As a result, the final equation would take the form of:
You can quickly see it shares the basic form of of Drake Equation discussed earlier. The equation and associate coefficients obviously need some work. We hope publishing it here will stimulate further interest and work in this area.
References
- National Recreational Boating Survey Report. Strategic Research Group. November 30, 2003. – provides some excellent insights into several variables discussed here.
- Appendix E. Failure Analysis Associates Summary. Letter by Robert K. Taylor dated August 2, 1989. National Boating Safety Advisory Council. Report of the Propeller Guard Subcommittee. Presented November 7, 1989.
- Boating Risk Analysis INformation System (BRAINS). U.S. Coast Guard. boatingrisk.com.
- An Inventory of Hazards and Risk Conditions in the National Parks. Golding, Tuler, Krueger. April 15, 2001.
- A Review of the Literature for a Comprehensive Study of Visitor Safety in the National Park System. Golding, Tuler, Krueger. April 15, 2002.
- Fatal Crash Involvements — What Are the Odds? Ezio Cerrelli. NHTSA Research Note. July 1997. National Highway Traffic Safety Administration. U.S. Department of Transportation.
- Fatal Incident Risk Factors in Recreational Boating in Ohio. Molberg, Hopkins, Paulson, and Gunn. Public Health Reports. Vol.108. No.3. (May-June 1993). Pgs. 340-346.

